Temperature Mapping: How to Find the Hot and Cold Spots in a GDP Warehouse
TL;DR: Temperature mapping is a study that measures air temperature at many points across a storage area for several days, to find where it runs warmest and coolest. The EU guidelines on Good Distribution Practice, which the MHRA lists for medicines distributors, say it should be done before a storage area is used, and that permanent monitoring sensors should then sit where the mapping found the extremes. WHO guidance supplies the method: a logger grid every 5 to 10 metres, several heights, and at least seven days in an ambient warehouse.
Last updated: 15 September 2026
On this page
Key takeaways
- The EU guidelines on Good Distribution Practice say an initial temperature mapping exercise should be carried out on a storage area before use, under representative conditions.
- Permanent monitoring sensors should then be placed where the mapping found the extremes of fluctuation, not where they are easiest to fix.
- WHO guidance suggests study loggers every 5 to 10 metres across the floor, at several heights, all recording at the same interval of 1 to 15 minutes.
- An ambient warehouse study typically runs for at least seven consecutive days, including a weekend, and in both the warmest and coldest seasons where the weather affects the store.
- Repeat the mapping after significant changes to the building or its temperature control equipment, or when a risk assessment says so. WHO gives every three years as an example.
What is temperature mapping?
Temperature mapping is a study that records air temperature at many fixed points across a storage area over several days, to show how temperature varies by position, height and time. It proves whether the whole space holds the labelled storage range, finds the hot and cold spots, and shows where permanent monitoring sensors belong.
The World Health Organization’s technical supplement on temperature mapping of storage areas is the most detailed public method. It applies to any space used to store products with a labelled storage temperature, including freezer rooms, cold rooms, temperature controlled warehouses, quarantine areas and loading bays, and it describes four stages: write a protocol, run the study, report, then act on the recommendations.
Temperature mapping is not the same as temperature monitoring. Mapping is a study, with many loggers for a limited time. Monitoring is the permanent system, with fewer sensors in the places the study identified. A warehouse needs both, in that order.
Is temperature mapping required for GDP?
For medicines distribution, yes. Government guidance on manufacturer and wholesaler licences says that to qualify for a wholesale distribution licence you must comply with Good Distribution Practice and pass regular GDP inspections, and the MHRA’s guidance on good manufacturing and distribution practice lists the EU GDP guidelines among the guidance to follow.
Section 3.2.1 of the EU guidelines on Good Distribution Practice is short and specific. An initial temperature mapping exercise should be carried out on the storage area before use, under representative conditions. Monitoring equipment should be located according to the results, in the areas that experience the extremes of fluctuation. The exercise should be repeated as a risk assessment requires, or whenever significant modifications are made to the facility or its temperature control equipment.
There is one concession for very small stores. For premises of a few square metres at room temperature, the guidelines accept an assessment of potential risks, such as heaters, with monitors placed accordingly. Section 3.3 then asks for monitoring equipment to be calibrated at defined intervals, traceable to a national or international measurement standard, with alarm systems that alert on excursions and are tested regularly.
The method is not only for medicines. WHO says its guidance applies to any space designed for storing temperature sensitive products, and names warehouse operators and third party logistics providers among its intended readers.
How many loggers does a temperature mapping study need?
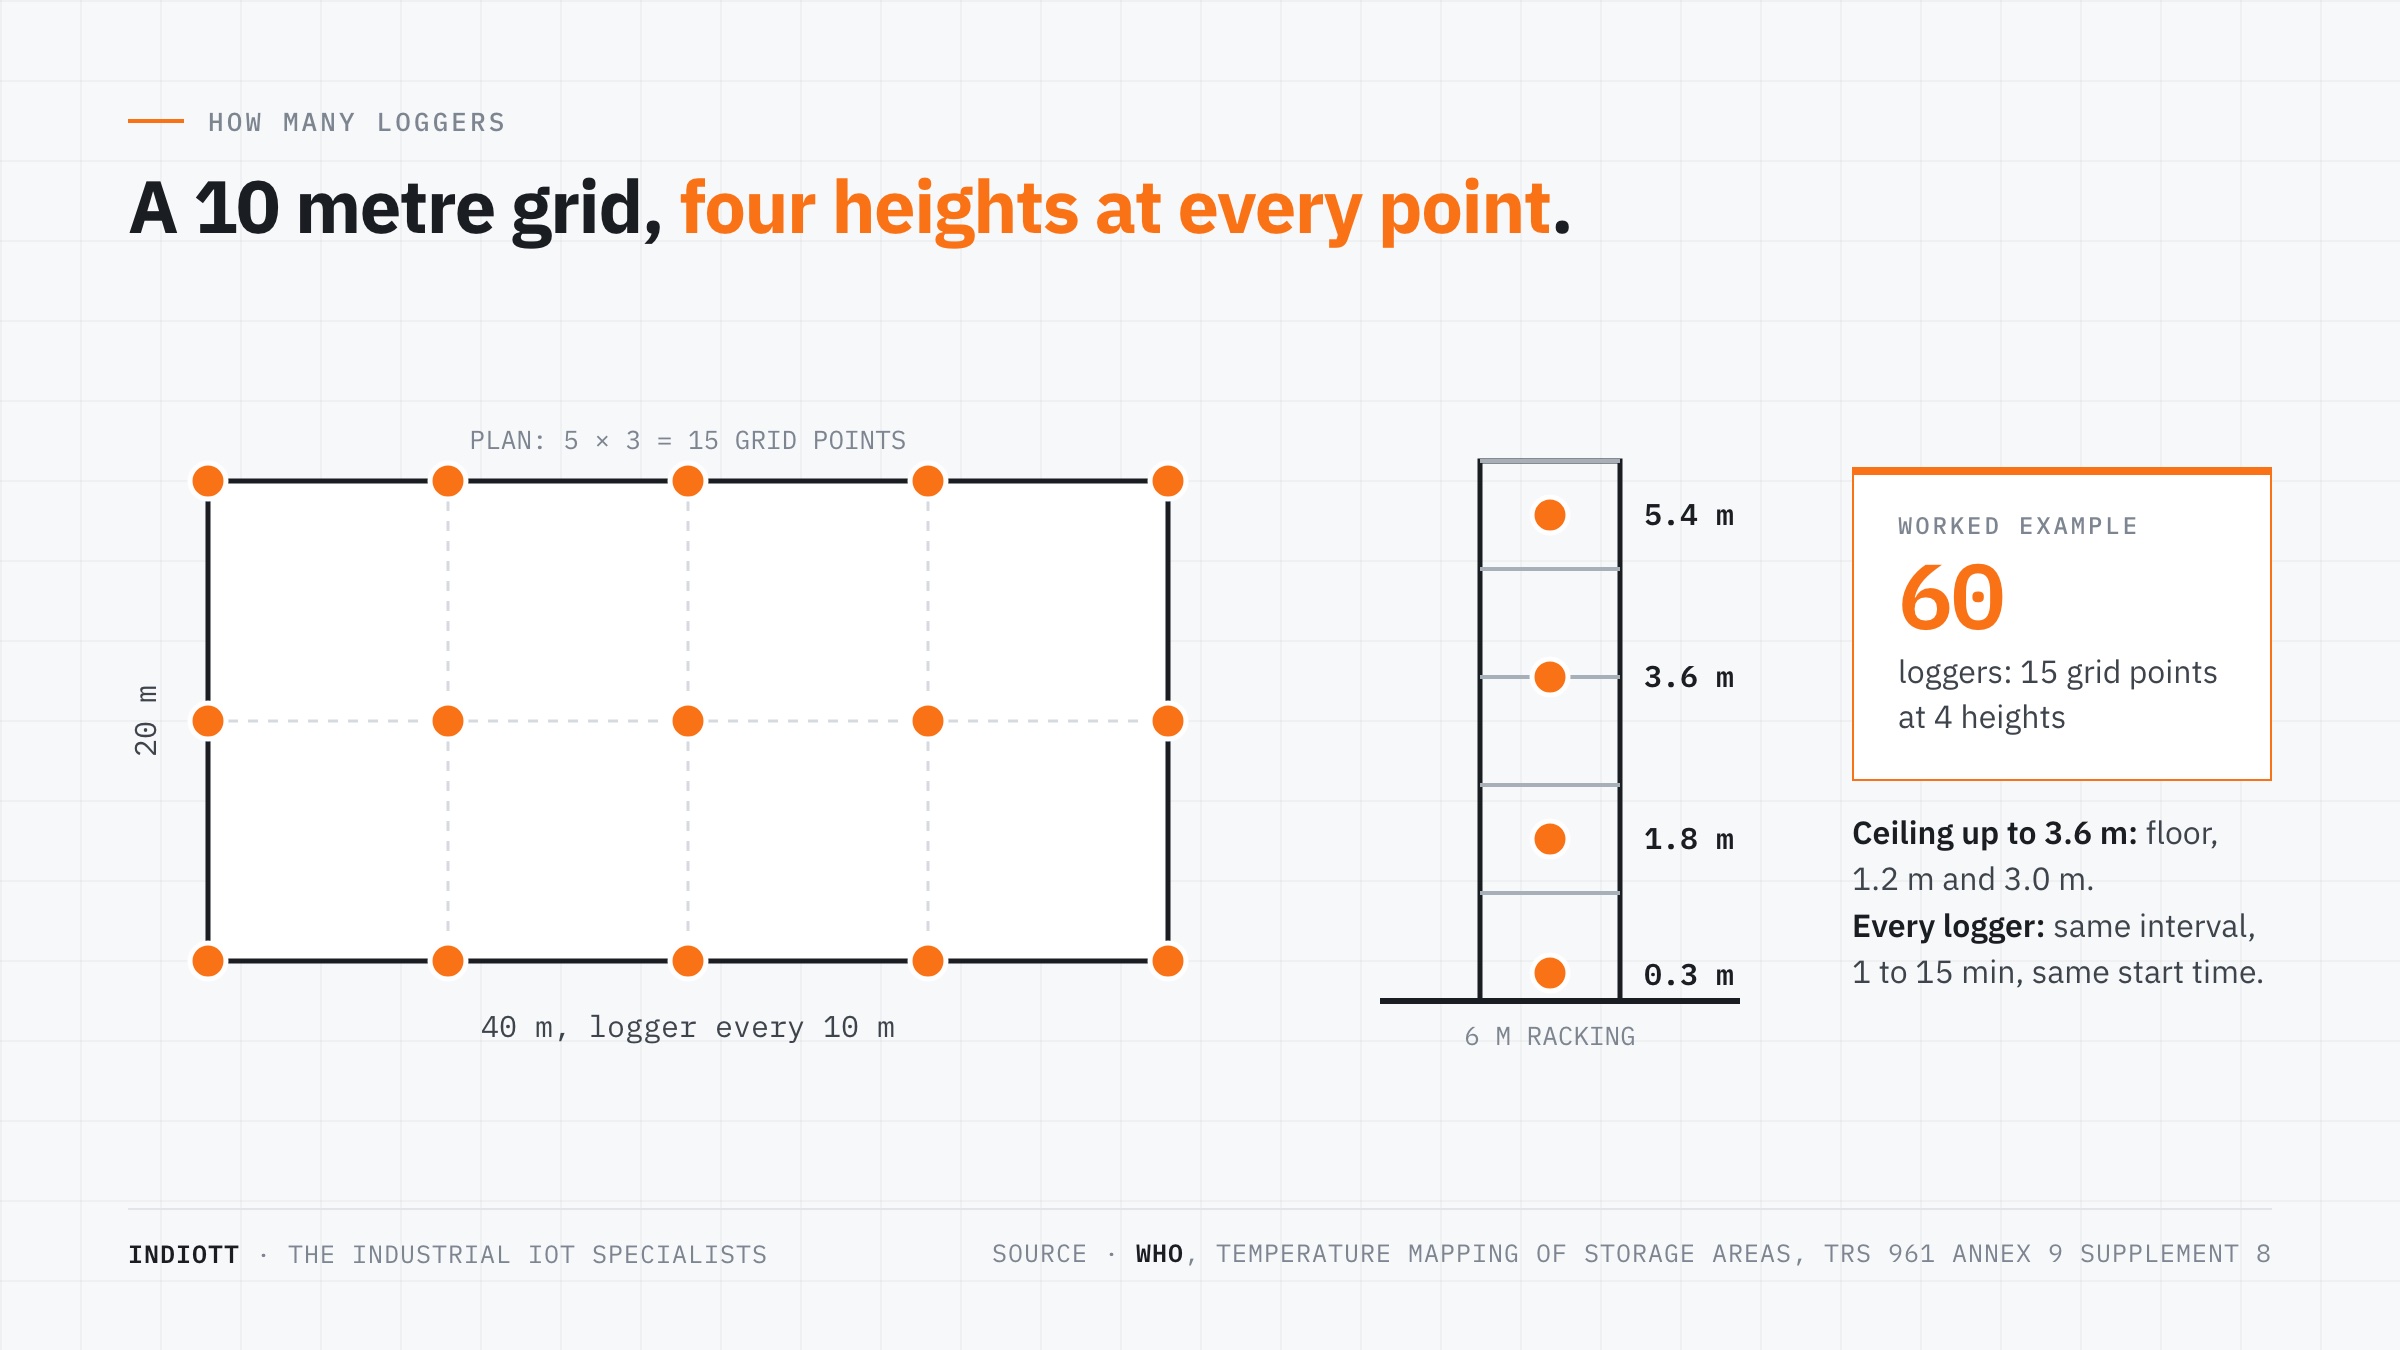
Usually far more than a handful. WHO suggests a grid of loggers every 5 to 10 metres along the length and width of the area, stretching to 20 or 30 metres only in very large facilities, with loggers at several heights at every grid point. Positions should match where products are actually stored.
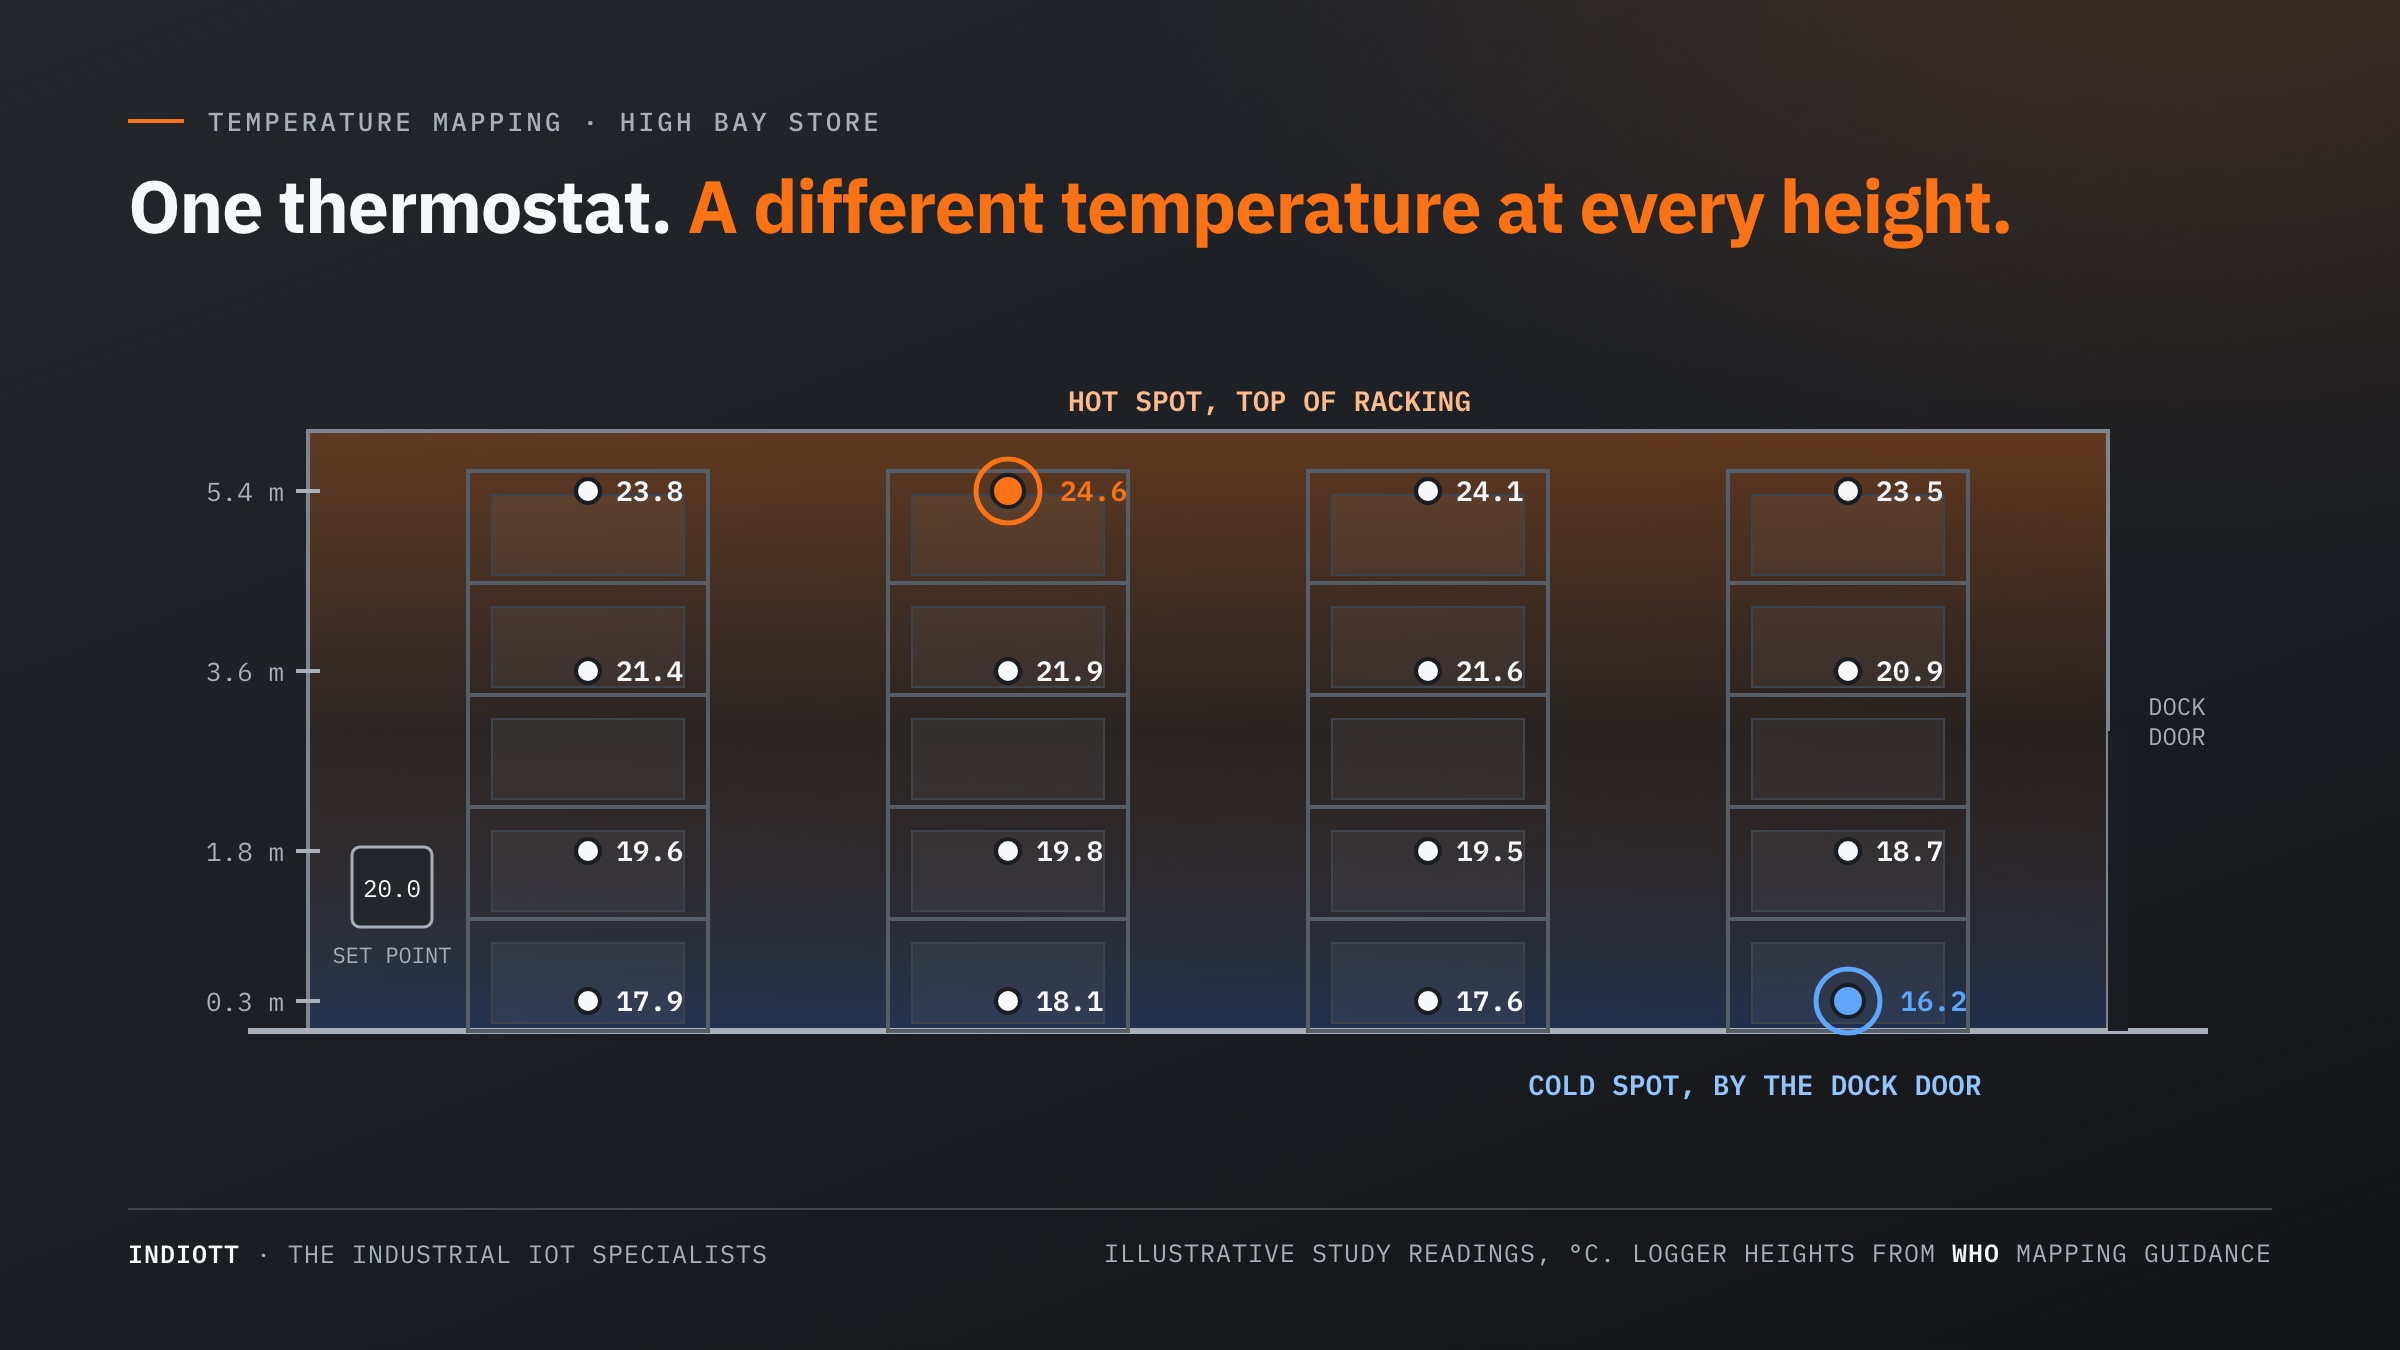
The height rule depends on the ceiling. Where it is 3.6 metres or lower, WHO suggests one logger at floor level, one at 1.2 metres and one at 3.0 metres. In a taller store the loggers form vertical arrays: for a 6 metre space, at 0.3, 1.8, 3.6 and 5.4 metres. WHO warns that high bay pallet racking is particularly prone to temperature stratification, so it must be mapped over its full working height.
The arithmetic adds up quickly. A 40 by 20 metre store with 6 metre racking, mapped on a 10 metre grid, has 15 grid points, and at four heights each that is 60 loggers for one temperature mapping study.
| Study logger requirement | WHO guidance |
|---|---|
| Grid spacing | every 5 to 10 metres |
| Heights, ceiling up to 3.6 m | floor, 1.2 m and 3.0 m |
| Heights, 6 m store | 0.3, 1.8, 3.6 and 5.4 m |
| Recording interval | 1 to 15 minutes, identical on every logger |
| Calibration | traceable 3 point certificate, error no more than ±0.5°C at each point |
Every logger should also start recording at the same time. WHO calls this essential, because readings that cannot be time correlated cannot be compared.
How long should a temperature mapping study run?
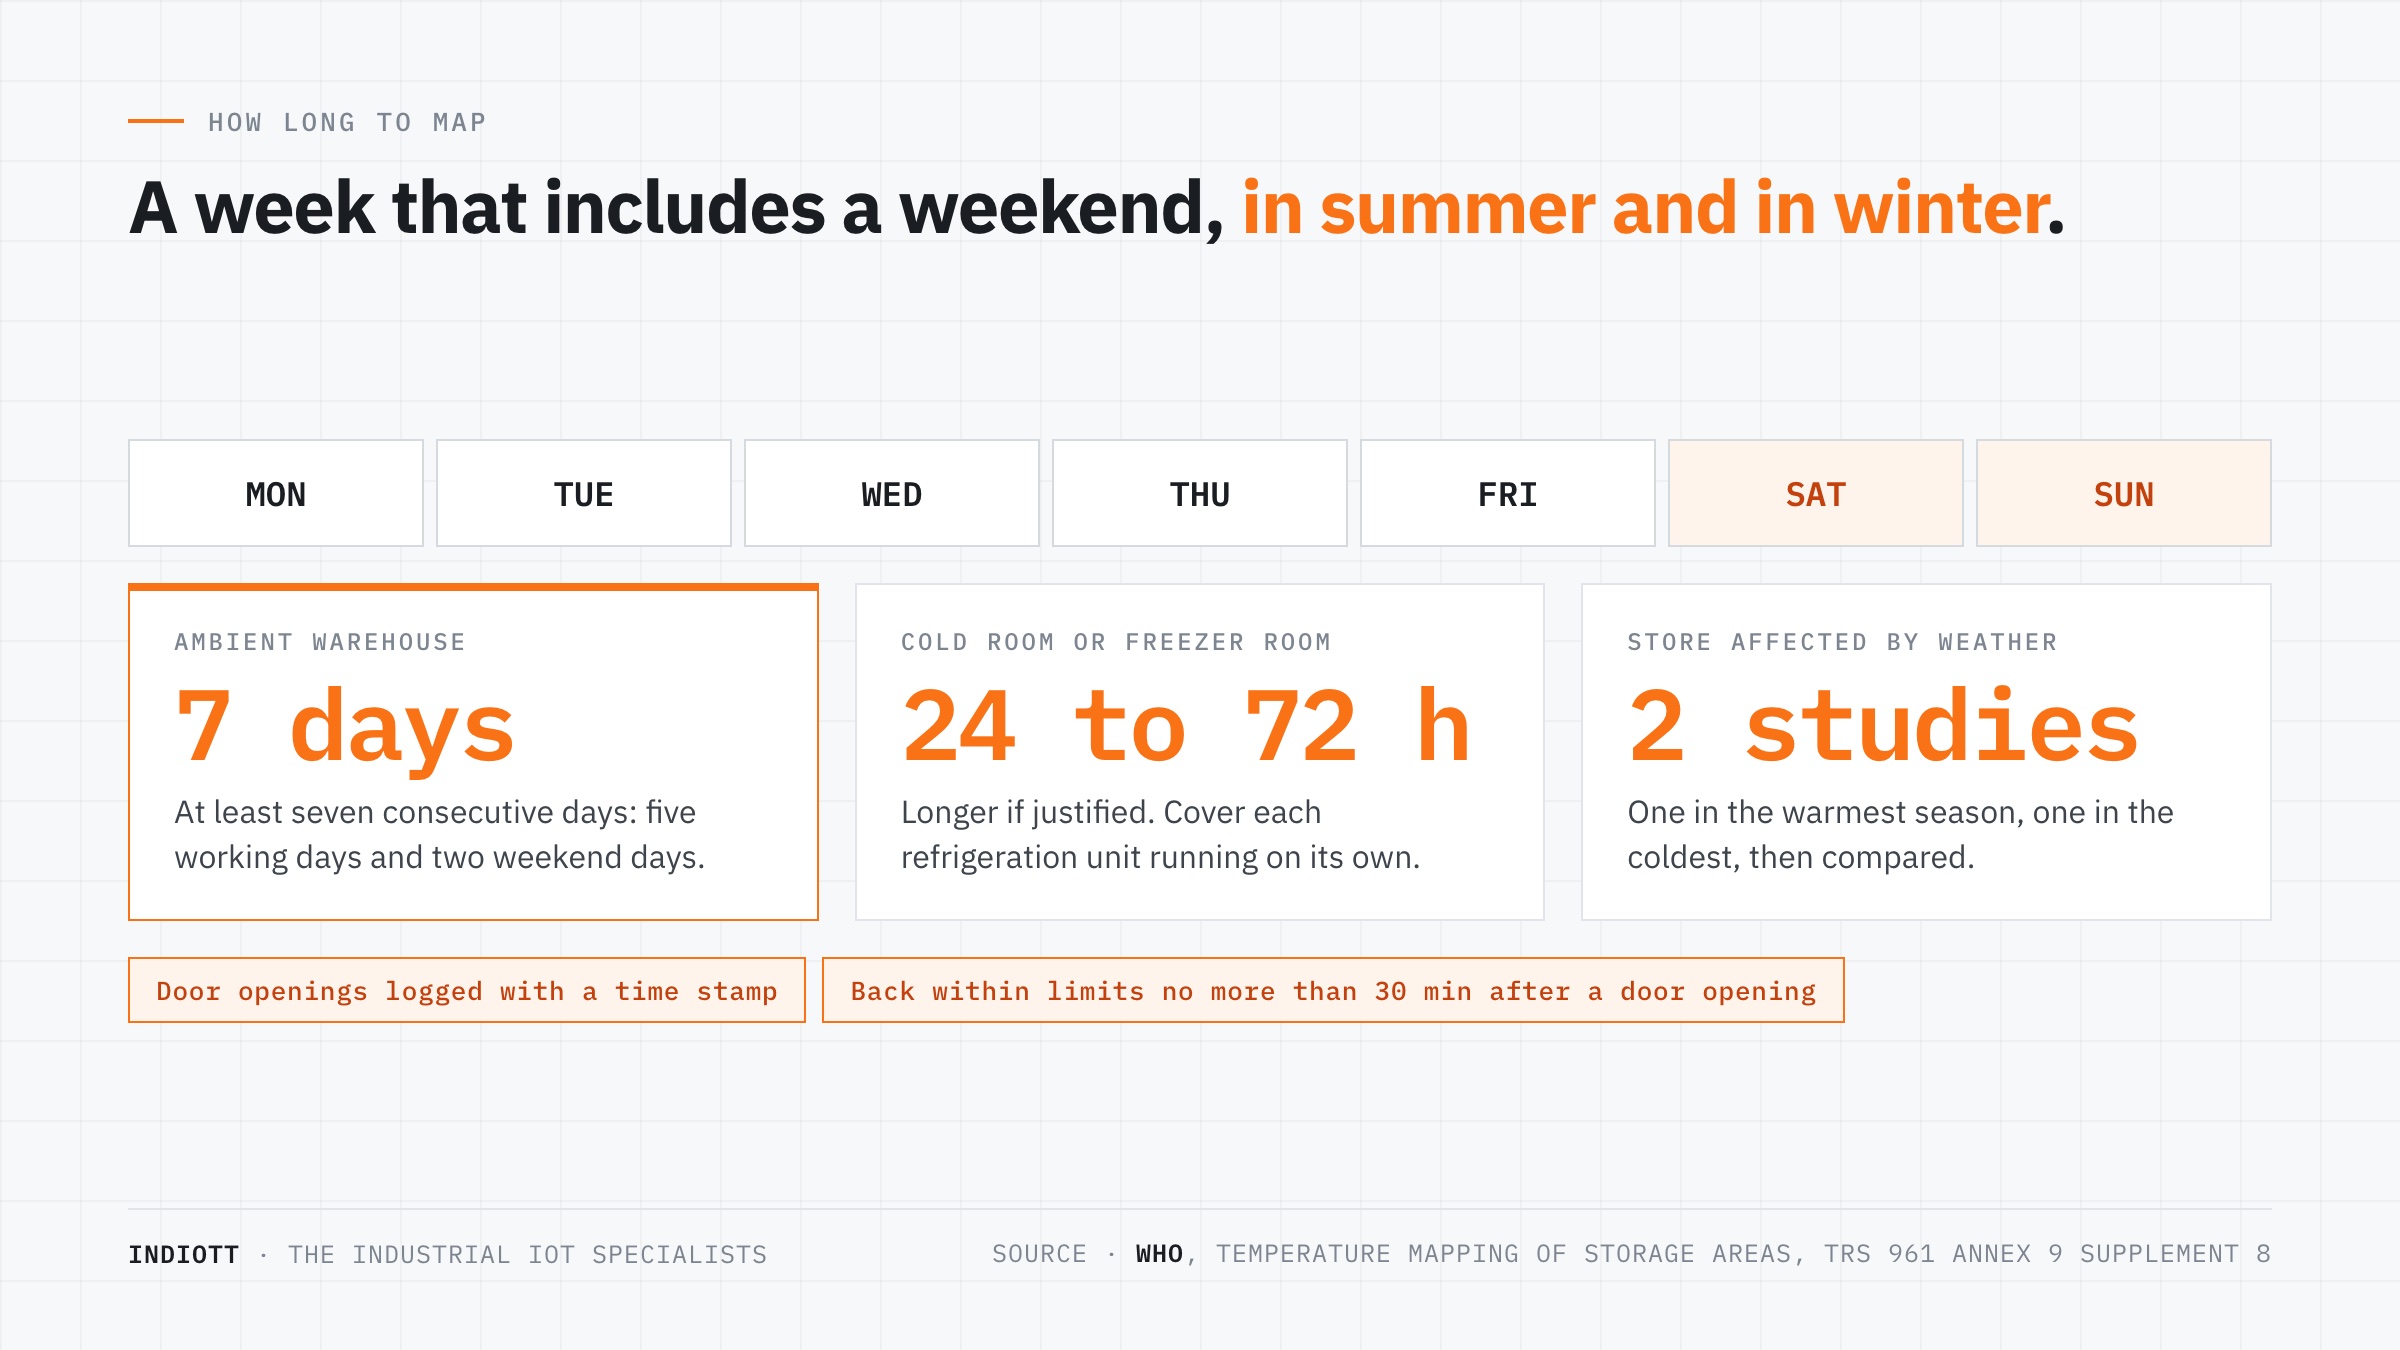
For a warehouse or other ambient store, at least a week. WHO says there is no formal time limit, but a study should typically run for a minimum of seven consecutive days, including five working days and two weekend days, so the data captures both busy shifts and a closed building.
Cold rooms and freezer rooms are less exposed to daily and seasonal swings, and WHO suggests 24 to 72 hours for them, or longer if justified. If a cold room has duplicate refrigeration units, the study should cover each unit running on its own, because the temperature distribution can change with the unit in charge.
The season matters for ambient stores. Where a store is affected by seasonal variation, WHO says at least two temperature mapping studies may be needed, one in the warmest season and one in the coldest. A warehouse mapped only in spring can look compliant while its roof space overheats in July and its dock area cools every January morning.
Doors are part of the test. If the study includes door openings, WHO says the protocol should define how often and for how long they open, and that temperature should stay within limits except for a maximum of 30 minutes after an opening. Time stamping each opening lets the report line the readings up with the door.
What happens after the mapping study?
The report turns data into decisions. WHO asks for the minimum and maximum temperatures in the space, the hot and cold spots, and the mean temperature at each logger position, because averages reveal locations that run consistently warm or cool even when their peaks look similar.
Three actions usually follow:
- Fix what the study found. Change air distribution, move stock away from heaters, coolers and cold air streams, and mark any zone that should not hold product.
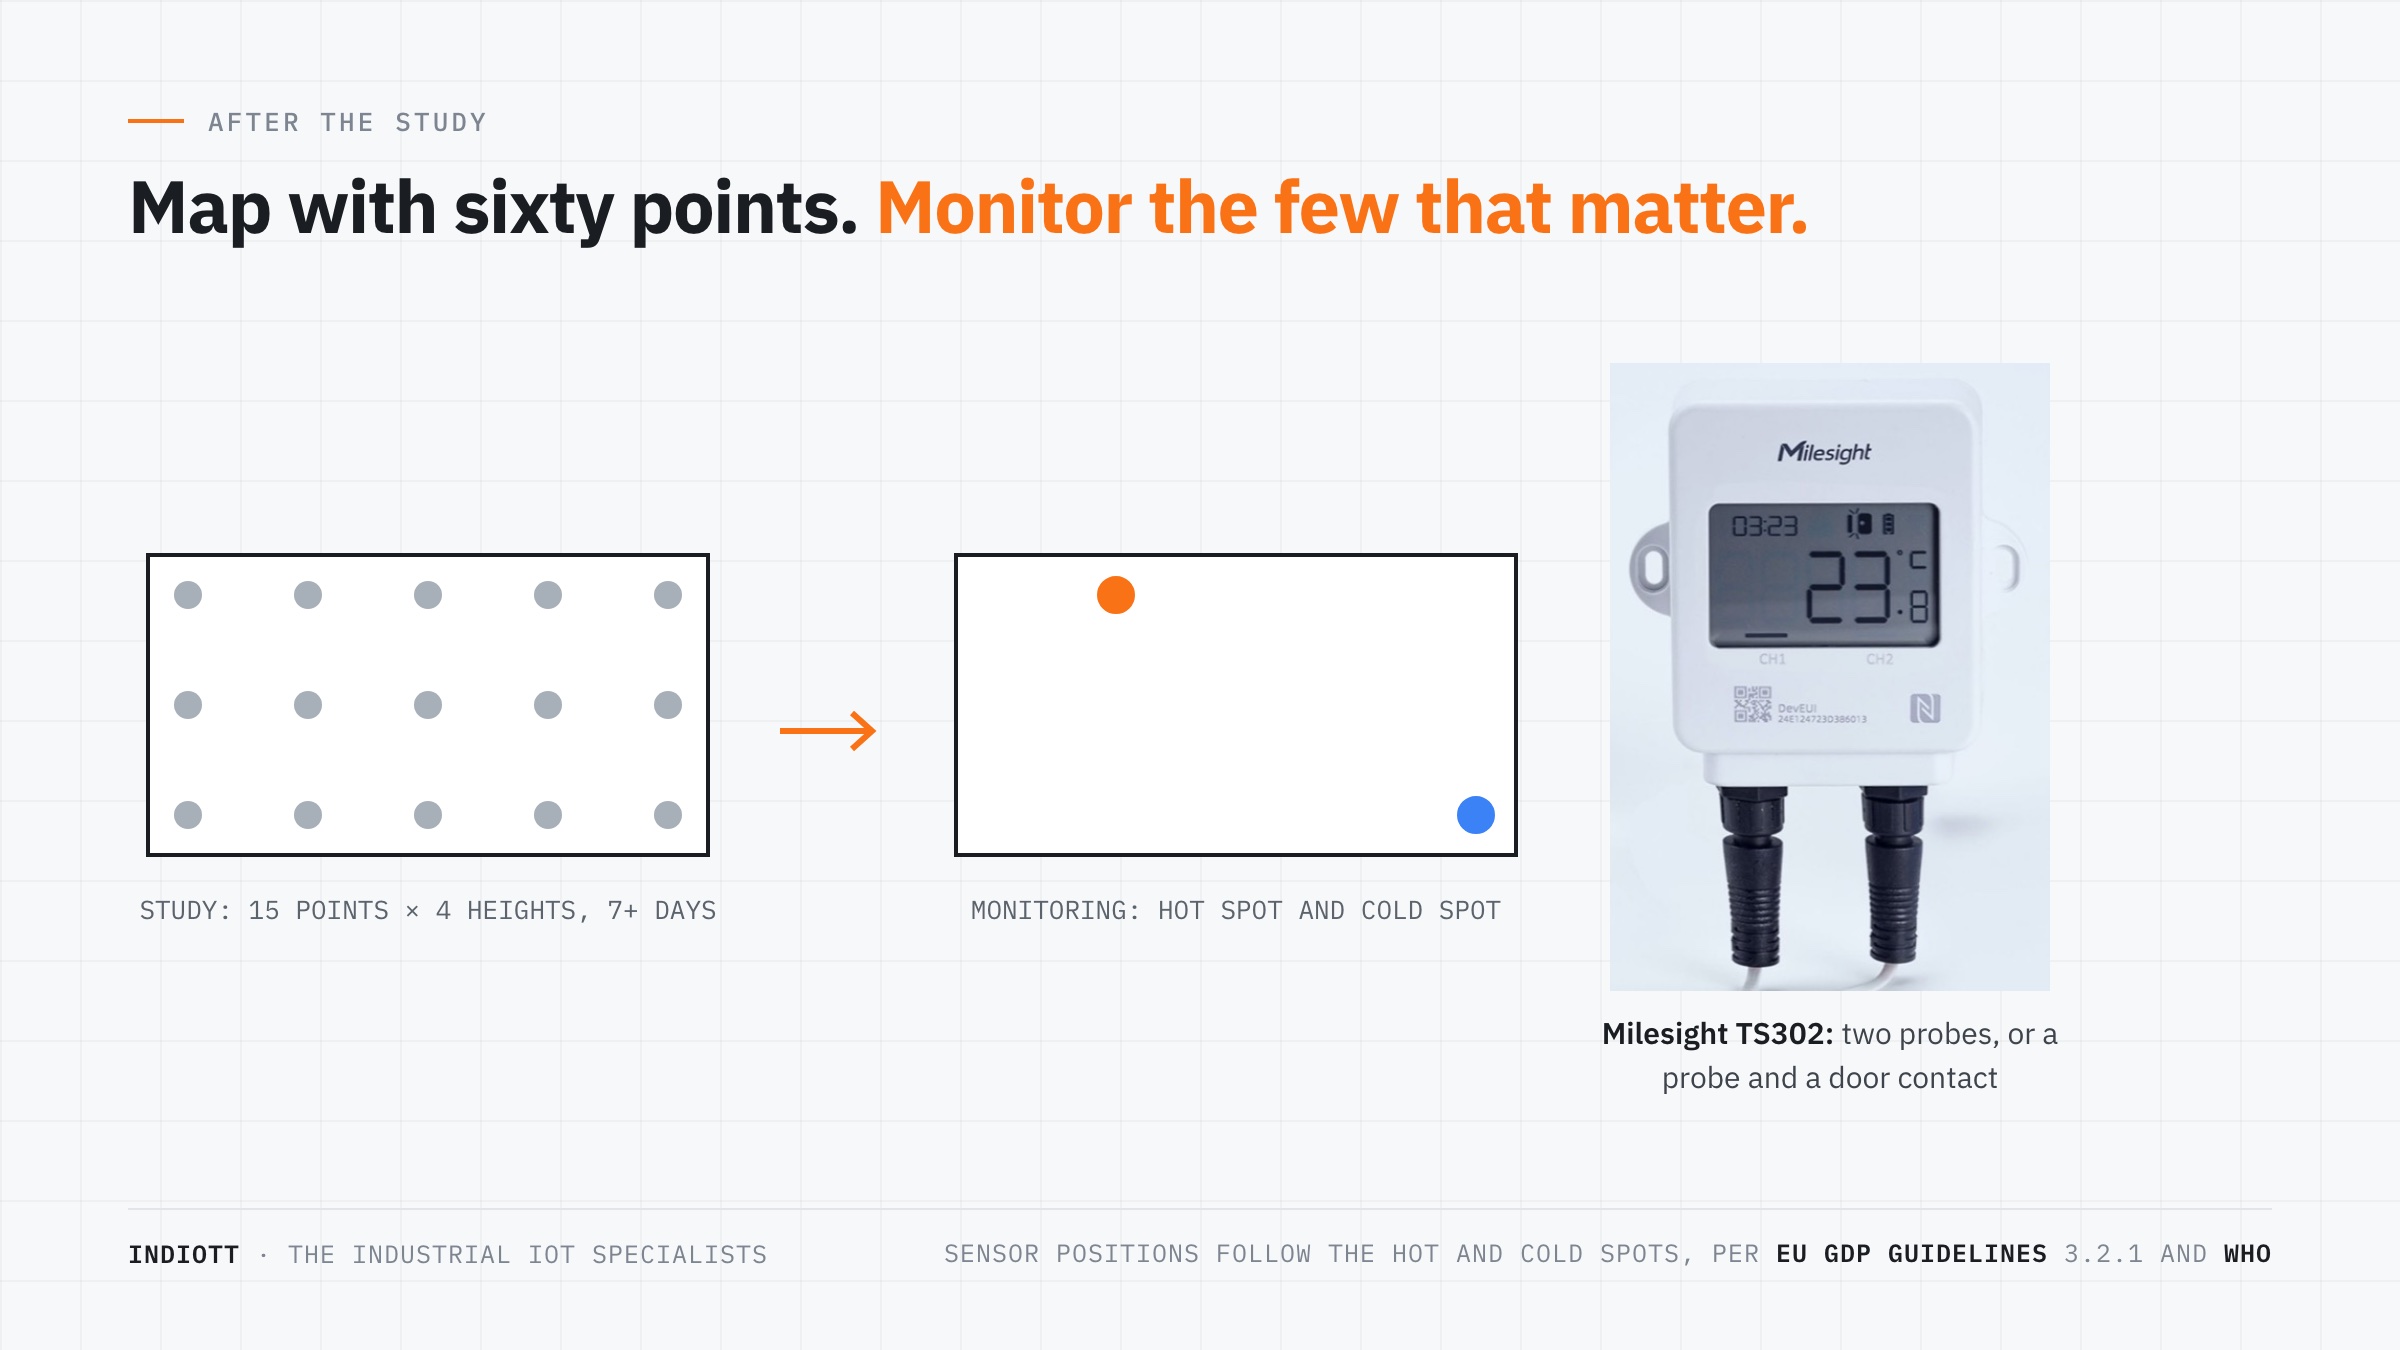
- Place permanent sensors at the extremes. WHO says the purpose of finding hot and cold spots is to show where monitoring sensors should preferentially go.
- Set and test alarms. The GDP guidelines ask for alarm levels to be set appropriately and for alarms to be tested regularly.
Temperature mapping is not a one off. WHO says it should be repeated after significant modifications, such as a change in loading pattern or a new refrigeration set point, and whenever monitoring records show unexplained variability. It gives every three years as an example of a periodic interval, but adds that where multiple fixed monitors provide continuous data, a periodic re-evaluation of the whole system may be more appropriate.
Can wireless sensors be used for temperature mapping?
Yes, if each device meets the logger requirements of the protocol: the right range, a common recording interval, a valid traceable calibration certificate and records that can be exported. The advantage of wireless sensors is that the data arrives during the study, so a failed or knocked logger shows up on day one rather than when the loggers are collected a week later.
The Milesight TS302 suits mapping and the permanent system that follows. It has an LCD screen and two probe connectors, and its temperature and humidity probe reads to a typical ±0.2°C between 0 and 60°C. It stores 10,000 readings, exports them as CSV or PDF, and complies with EN 12830 for cold chain use. One connector can take a magnet switch instead of a second probe, which time stamps door openings alongside the temperature. It is listed from £64.34.
For racking positions where no screen is needed, the Milesight EM300-TH reads temperature to a typical ±0.3°C between 0 and 70°C in an IP67 housing, and is listed at £38.90. Whichever sensor you choose, confirm what its calibration certificate covers before the study starts, and file a copy with the mapping report.
Both are LoRaWAN sensors, so they need a gateway such as the Milesight UG65. After the study, the sensors at the hot and cold spots can simply stay where they are and become the monitoring system.
Frequently asked questions
What is temperature mapping?
Temperature mapping is a study that records temperature at many points across a storage area for several days. It shows whether the whole space stays within its storage range, where the hot and cold spots are, and where permanent monitoring sensors should go.
How often should a warehouse be temperature mapped?
Before first use, after significant changes to the building, its layout or its temperature control equipment, and as a risk assessment requires. WHO gives every three years as an example, and suggests a periodic re-evaluation where fixed monitors already provide continuous data.
How many data loggers do I need for temperature mapping?
WHO suggests loggers every 5 to 10 metres across the floor, at several heights at each point: three heights for ceilings up to 3.6 metres and more for taller stores. A 40 by 20 metre store with 6 metre racking on a 10 metre grid needs around 60.
How long does a temperature mapping study take?
For warehouses and other ambient stores, WHO suggests at least seven consecutive days, including a weekend. Cold rooms and freezer rooms typically need 24 to 72 hours. Stores affected by the weather may need studies in both the warmest and coldest seasons.
What is the difference between temperature mapping and monitoring?
Mapping is a time limited study with many loggers that finds how temperature varies across a space. Monitoring is the permanent system, with fewer sensors placed at the hot and cold spots that the mapping identified, plus alarms.
Where to start
Draw the store before buying anything. Mark the racking heights, heaters, coolers, roof lights, dock doors and where stock actually sits, then lay a 5 to 10 metre grid over it and count the positions. That count, multiplied by the heights, is your logger number.
Then pick the season. If the next study falls in winter, plan the summer one now. Our guide to warehouse temperature monitoring covers the permanent system, the pharmaceutical IoT page covers the wider GDP picture, and the Kit Builder will price the sensors and gateway for your temperature mapping plan.
Next step
Get a priced kit list for your site
Answer three quick questions and tell us where to send it. An engineer replies within one working day with the parts, the prices and the lead time.
Rather talk it through? Call 023 9223 3611
Received. An engineer has it.
You will hear back within one working day with the parts, the prices and the lead time. A confirmation is on its way to your inbox.
If it is urgent, call 023 9223 3611.